 [1]
[1]
by John Helmer, Moscow
@bears_with [2]
The Axis of Resistance — that’s the Arab militaries with Iran and in the background, Russia – knows how to wage economic warfare against the US and its proxy, Israel. The Houthi sanctions on shipping, for example, are showing more effectiveness in stopping Israel-bound or Israel-linked vessels in the Red Sea than US sanctions have been to block Russian oil shipments.
In attrition war, on the economic front just like the Gaza and other fire fronts, the Axis of Resistance wins by maintaining its offensive capacities and operations for longer than the US and US-backed Israeli forces can defend. Like troops, tanks, and artillery pieces, the operational goal is to grind the enemy slowly but surely into retreat, then capitulation.
How to measure if this is happening now to the Israelis in the international money markets?
An international currency and bond trader answers by providing, first, a primer for each of the market indicators, and how to read them; and then a ready reckoner for the damage being done to Israel’s economic resources as those who operate in the money markets gauge their opportunity.
For making money, you see, the opportunity of capitalizing on Israel’s defeat may soon be more profitable than investing in its success. When the markets see this chance at profit-making, usually long before the politicians and their captive media acknowledge it, there is an inflection point in the flow of money. That does its damage, not by hitting the Israelis and Americans in their bunkers with bullets and bombs, but by moving the money the US-backed Israeli entity needs out of reach, and cutting them off, both the US and Israel, from market confidence that they can win their war, genocide or not.
The writer of this primer and money-market assessment has requested anonymity to protect against retaliation from the US, Israel or their allies.
 [3]
[3]Primer for the money markets
Understanding market indicators is crucial during prolonged conflicts. To forecast the outcome of the conflict, you need a gauge for how financial markets respond to the evolving geopolitical situation.
Contrary to the conventional wisdom, the foreign exchange (forex, currency) markets are the first markets to look at. There are the safe haven currencies: issuers from the strongest military countries – RUB (Russian Ruble), USD (United States Dollar), CNY (Chinese Yuan), and the currencies of the trading and financial hubs, CHF (Swiss Franc), GBP (British Pound), AED (United Arab Emirates Dirham). You can add others when they are appropriate in the circumstances of the war you are waging, defending, or betting on.
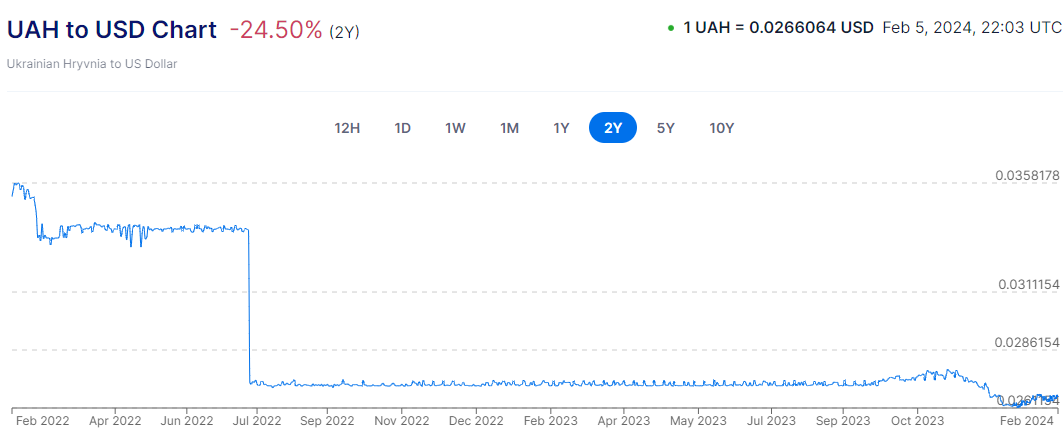
Then there are warzone or associated currencies: you must monitor the currencies of countries directly involved in or closely tied to the conflict. Currency depreciation may also signal economic problems developing under the fog of war – the EUR (European Union Euro), TRY (Turkish Lira), and ILS (Israeli Shekel). I don’t include the UAH (Ukrainian hryvnia) as it is entirely dependent now on life-support by the US and EU (with the risk of hyperinflation). The market bids up the currencies of countries which are winning their wars, and bids down the currencies of those which are losing.
THE COLLAPSE OF UAH TO USD SINCE THE WAR BEGAN
 [4]
[4]Source: https://www.xe.com/ [5]
Not everyone has access to the Reuters or Bloomberg databases which traders use. Do your own research to select your data feeds but this information has become widely available. The real-time data-feed providers charge premium prices. If you can live with delayed quotes or secondary market makers, much of the longer trend data is available today for free on the internet.
The intraday charts are more for professionals or traders having to move large positions. You should note the time of day when the bid/ask spread is the narrowest. That is when most traders are active on both sides of the trade. Weekends, after-business hours, or when decisive news from the battlefield is anticipated, the bid/ask spread widens or there are no prices being made. Let the buyer beware when there is no confidence in what will happen next. Astute traders exploit the arbitrage opportunities between the various markets which view the battlefield from different points of view and with different sources of information; in this game you must have big money and low transaction costs to play.
The longer time period charts show underlying trends more clearly, as well as the currency support and resistance levels.
The forward market gives prices at fixed time intervals into the future; these are indeed wagers on the future. The spot market gives the parties two business days to settle the trade. Popular longer time periods are straight one week, one month, three months, six months, nine months, and one year.
Forward contract pricing is based on interest rate differences between the two markets. This is why you should start looking at the forex spot market first.
Many money market traders prefer to start with government bond markets. Russia and China are net creditor countries so their bonds are relatively thin or even not available due to sanctions. In order to move from one market to another (even in bonds) traders will have to move through the forex market, so I recommend starting here first. This is where most of the liquidity is.
Non-deliverable forwards [6](NDFs) . are the handy tool operated offshore to get around trading restrictions. NDFs are executed as swaps and are cash settled for the differences instead of the nominal amounts. In Europe most of these are settled in USD or EUR. For more info see this. [7]
Next up is the bond market.
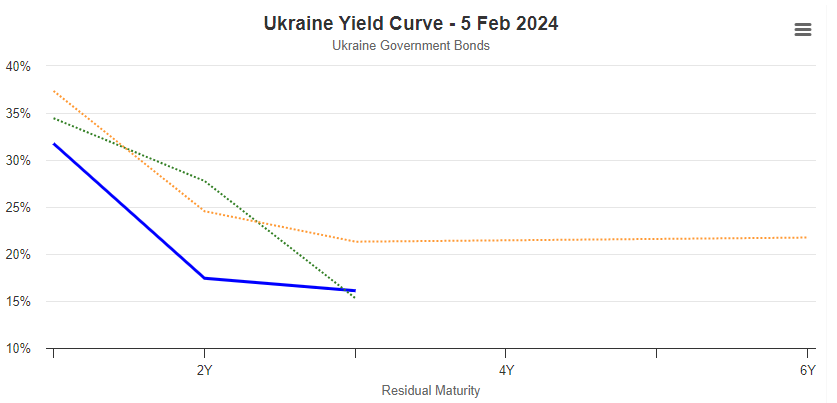
Government bonds: follow the yield [8] the spread between short and long term rates. Government bonds are bought when other more risky assets are sold. This is to reduce third-party risk (if the money is on a bank account, the bank owes you the money — if you buy a government bond, the government owes you). Governments are insensitive to changes in market conditions. They will borrow as and when they need to, as well as to roll over previously issued debt. New issues, their amounts, and other details are usually published well in advance. Take note if the government you are following is borrowing in a foreign currency. This is acceptable in certain situations but is often a sign of weakness.
For a country in war, the more uncertain the outcome, the sharper the drop in the yield curve into the future. In the case of the Ukraine, as it loses its war, the more desperately it needs to borrow funds, and the shorter the period of time in which buyers of Ukrainian bonds will invest in order to make their profit. Note when the yield increases, the bond prices decline. UAH yields have had to increase sharply as the war progressed. Without the sharp yield increase the UAH bond would have been toilet paper. It still might become that.
 [9]
[9]Source: https://www.investing.com/ [10]
When there is uncertainty in the markets, there is a flight to safety. Increased demand for safe-haven assets mean rising bond prices and lower yields. A sharp drop in yields is a signal that money is moving out of the declining, riskier market. It may be moving offshore into another currency. Large transactions are often spread out over time to keep a low profile, and mask the calculations of the big-money players from the smalltime bettors.
Corporate bonds: by monitoring the spreads between corporate and government debt you may be able to follow the way the market is calculating the risk between corporations and between corporations and governments. Defaults are a sign that businesses are struggling to sustain their revenues and meet their costs and debts. This is usually the signal for more market intervention from central banks, later from governments acting with fiscal instruments or regulatory and legal measures. The bond markets should be followed first because they are considerably bigger than stock markets, and harder in which to conceal expectations or rig values.
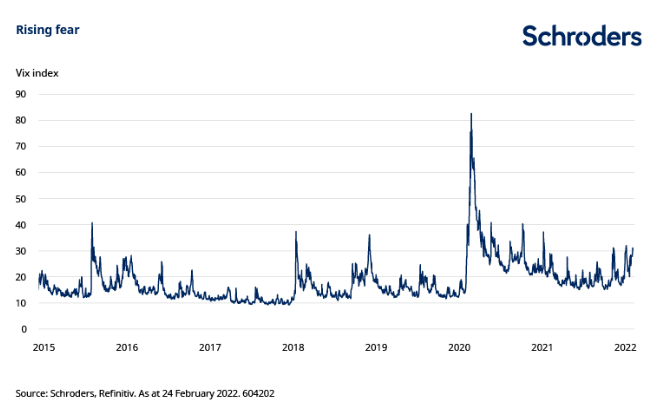
The stock market is best followed by a volatility index (VIX) [11]. This is also called the fear index — it measures the level of volatility in stock prices for the thirty-day period ahead. This is the foundation of derivatives pricing. Increasing volatility often means that many traders will have decided to leave the market. This then increases the price spread and reduces number and quantity of bids/offers. Such markets can be “pushed” (manipulated) often through derivative contracts.
VIX REACTS TO THE START OF THE UKRAINE WAR
 [12]
[12]Analysis at source: https://www.schroders.com/ [13]
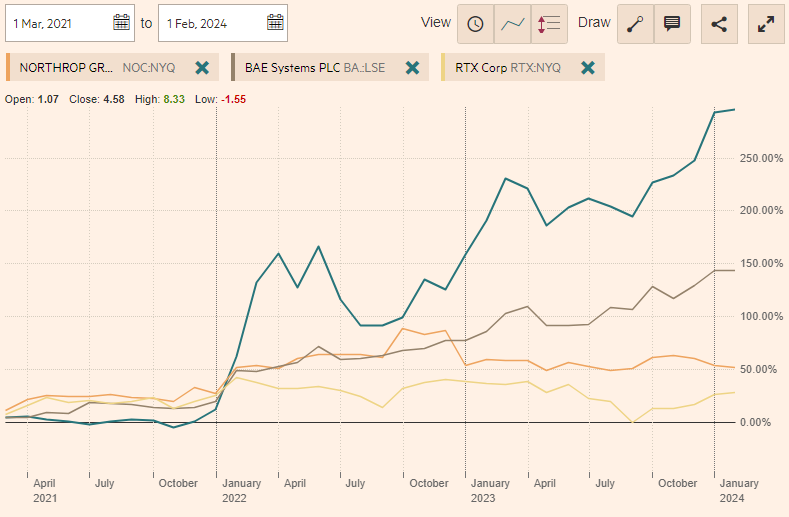
Conflict stocks are military, weapon, and ammunition suppliers which see higher demand during a prolonged war. If there is a shortage of a particular product or service needed by one of the belligerents and their suppliers refuse or cannot expand production /service, then you know the conflict is lost. This is actually the case for missile, tank, and artillery, as well as for 155-mm artillery shell manufacturers in the collective West. Following these stocks will show you the market sentiment on how the battlefield is going for one side or the other. Chinese and North Korean military providers are almost all state owned. They are difficult to follow and next to impossible to trade.
SHARE PRICE TRAJECTORIES OF THE MAJOR US, EUROPEAN ARMS MAKERS OVER THE COURSE OF THE UKRAINE WAR
 [14]
[14]KEY: grey=Rheinmetall; green=BAE; orange=Northrup-Grumman; yellow=Raytheon (RTX). Source: https://markets.ft.com/ [15]
Commodities: All economies depend on energy. Geopolitical power is based on who controls it. Supply disruptions (Houthis) or concerns for global economic growth (EU deindustrialization) can lead to volatility in oil and gas markets (and then buyer’s markets).
Gold and precious metals: Often seen as safe-haven assets, the prices are often manipulated by derivative contracts. Statistics are not reliable (no audited statements from key players like the Federal Reserve). Refineries remelt bullion into different size bars. If they produce more measured in ounces or in kilograms for good delivery, you can guess whether the flow is west (collective West) or east (Russia, China). Mining and refining companies are often very well informed (it’s their business).
Trade Balances: Changes in trade balances indicate relative strengths often based on military muscle providing insight into how global commerce is affected by the conflict. Steel, aluminum, and concrete top the war indicator list. Strategic metals are the Achilles Heel for many purchasers. Shipping rates are also a good leading indicator.
PMI (Purchasing Managers’ Index): A decline in PMI may indicate economic contraction, influenced by the disruption caused by the prolonged war.
Sentiment surveys of these types will confirm whether the markets are calculating differently about the course of war than the general sentiment, fed as it always is by propaganda from all sides. Money market traders think that profitable trading ideas are usually the opposite of the general sentiment. They bet against conventions, but they don’t bet in the dark. So what you see the traders doing is often a glimpse of what the future of the war will turn out to be – who will win, who will lose, and at what cost.
 [16]
[16]Ready reckoner for Israel now and coming
Israel is a small place with just over nine million population.
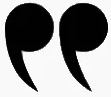
The forex chart for the Israeli shekel (ILS) shows a slow but steady devaluation against the dollar until the beginning of the Hamas offensive on October 7; that’s when the decline in value accelerated sharply. This signals that the Jewish diaspora was sending US dollars to assist Israeli family members out of work or out of cash, and countrymen looking to leave the country. The shekel is very thinly traded and easy for the Israeli warfighters to manipulate, masking the real market impacts of the war.
DEVALUATION OF THE SHEKEL AGAINST THE DOLLAR
 [17]
[17]Source: https://www.xe.com/ [18]
But beware of shekel rigging by the Israeli government and the Jewish diaspora in the US! This is how it was done in the very first days, primarily by Israel’s Central Bank [19].
Note that in October 2023, options traders saw a near-70% probability that the shekel would weaken to 4 per dollar in a month — a level unseen since 2015 — compared with only an 18% chance the day before the Hamas operation. Intervention has brought the shekel down from a peak of just over 4 to 3.67 this week. The shekel is one of the biggest losers this year among a basket of 31 major currencies tracked by Bloomberg.
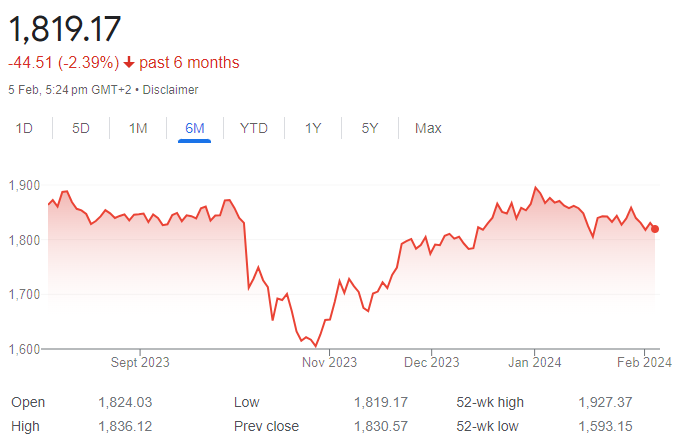
The Tel Aviv 35 Index (TA-35) closed on February 1 at 1817.83. This amounts to a recovery from the collapse of stock value in the first four weeks of the Hamas operation, when the index hit a low of 1605.20 on October 26. While this market is also easy for the Israeli government and the diaspora to rig, the rise in value indicates how much confidence has been generated by the Israel Defence Forces operations in Gaza, and by market sentiment that Israeli is winning its war against Hamas; genocide has been positive for the shekel and for the TA-35.
TRAJECTORY OF ISRAELI STOCK MARKET PRICE INDEX, TA-35
 [20]
[20]Source: https://www.google.com/ [21]
The Israeli bond market is heavily dependent on US state and local governments for 75% of their issue (about $150 million out of a total issue of $200 million) as of last October. This isn’t a bond market as traders understand it, because US government policy, backed by the media, and enforced by the Israel lobby and Jewish communities around the US, ensure there is no loss of confidence in the value to maturity of the bonds. This is market rigging with a difference – it is religious and ideological, as well as political. Even in the relatively short history of the Vatican banks [22], there has never been a time or an example of an international religion, combined with state governments and their military forces, to insist that the value of their money is backed by their god, or G-d as they report his spelling. By definition and faith, G-d cannot default; but the Israeli state can.
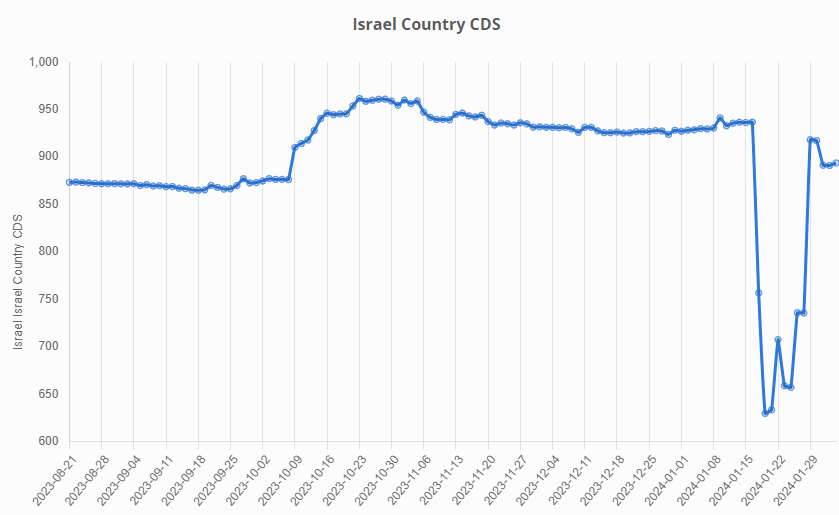
The Israel 5-year sovereign credit default swaps (CDS) are measured and reported to indicate market sentiment on the likelihood of a default, and the premium required for upfront payment in case default occurs [23]. In recent time this reached a maximum value in early 2009. The immediate impact of the start of war last October was the small uptick visible in the chart and the flat line from then until mid-January. Since then, however, with the growing demonstration of the Ansarallah (Houthi) capacity to blockade Israeli shipping in the Red Sea and Gulf of Aden, the increase of operational strikes on the northern (Hezbollah) front, and the impact of new Arab and Iranian offensive operations in the west (Syria, Iraq, Jordan), the perception of default risk has been returning to the October peak.
 [24]
[24]Source: https://macrovar.com/ [25]
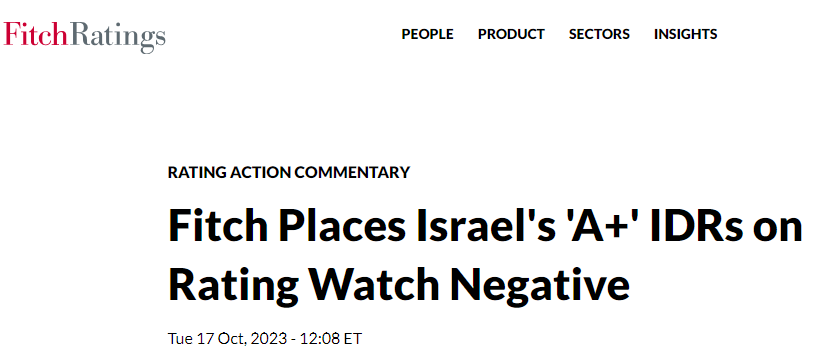
Reaction to these charts and values on the part of the international ratings agencies has been, first to put Israel debt issues on negative outlook, and then, second, on downgrades. Negative ratings from the agencies raise the cost of servicing Israel’s state and corporate bonds, and put pressure on the state budget. A ratings downgrade is a signal to the markets to go negative against the issuer – this usually follows a change in trader sentiment.
In Israel’s case, however, there has been an exceptional delay between negative outlook and downgrade. The last Fitch report on Israel was dated October 17; Moody’s followed on October 19; Standard & Poors (S&P) on October 24 [26]. There has been no new ratings report from Fitch, Moody’s, and Standard & Poor’s since then.
This indicates that enormous pressure is being applied to the ratings agencies and individual analysts not to notice the steady deterioration of the IDF’s military positions in Gaza and Lebanon; the collapse of shipping into and out of the port of Eilat; and the escalation of the regional war against US bases supporting Israel, including US and allied military operations around the Arabian peninsula, bombing and missile attacks across Syria and Iraq.
 [27]
[27]Source: https://www.fitchratings.com/ [28]
For analysis of the rating reports in October, click to read [29].
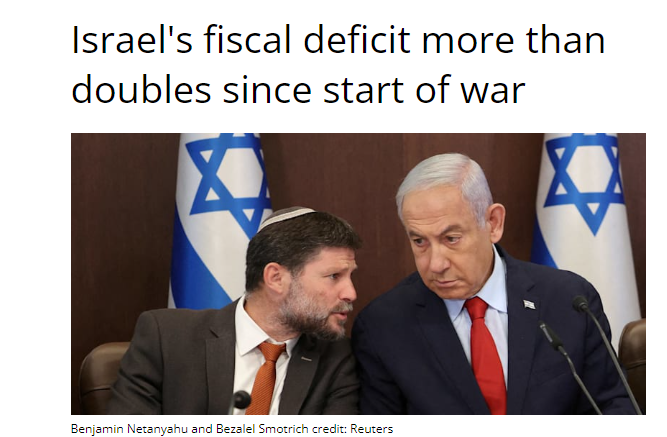
Reuters and the Israeli press have reported that Israel acknowledged a budget deficit of 22.9 billion shekels in October, a leap from 4.6 billion in September; this pushed up the budget deficit over the prior 12 months to 2.6% of the country’s Gross Domestic Product (GDP). The deficit should increase as war damage accumulates. According to Reuters reporting [30] in December, Israeli officials were admitting then it was “not possible to plan for the possibility that the war against Gaza’s Palestinian Hamas Islamists would stretch into March or beyond.”
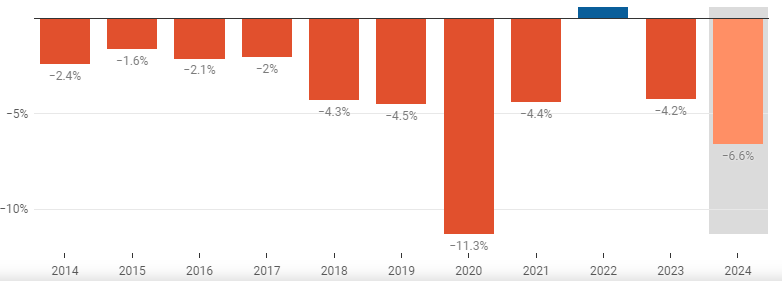
By the end of December, the budget deficit had risen to 4.2% of GDP. By the end of January, the projection for this year had risen [31]to 6.6%.
 [32]
[32]Bezalel Smotrich, left, is Israel’s finance minister. Source: https://en.globes.co.il/ [33]
ISRAEL’S BUDGET DEFICIT AS PERCENTAGE OF GDP
 [34]
[34]The all-time negative budget deficit/GDP ratio was recorded at 16.1% in 1981. Source: https://tradingeconomics.com [35]
As real estate and other tax collections collapse, Israel will have to make a large cash call on the US. This is going to come in the near future, just as the government in Kiev has been forced into calling on Congress as the Ukraine war is being lost. The longer both wars are protracted, the more obviously the loss of confidence expresses itself in the US Congress.
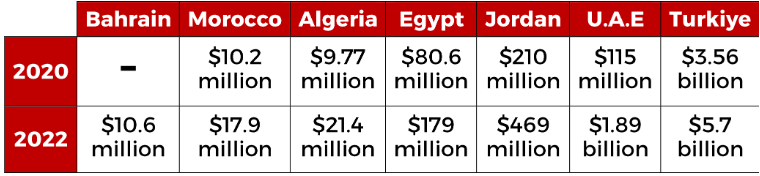
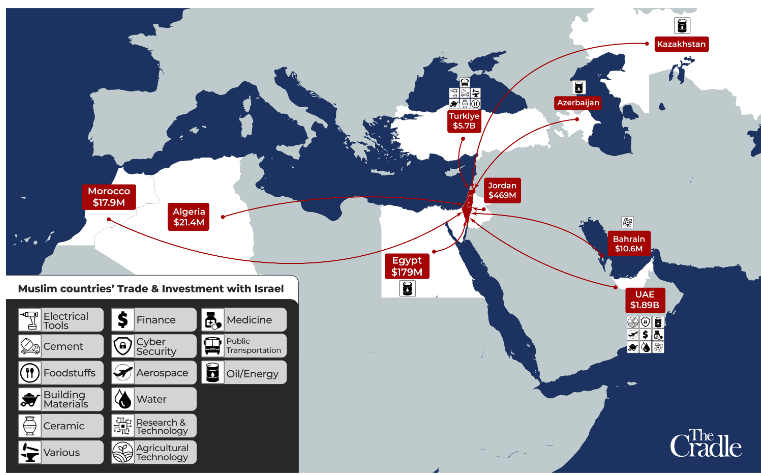
The Axis of Resistance retains its military capacities for escalation on all fronts. But for the time being, the Arab states and Turkey have yet to introduce a blockade of their export shipments to Israel, and back a worldwide boycott along the lines of the anti-apartheid campaign [36] against South Africa from 1959 until 1994.
ARAB STATE AND TURKISH GROWTH OF TRADE WITH ISRAEL SINCE 2020
 [37]
[37]Source: https://thecradle.co/ [38]
 [39]
[39]Source: https://thecradle.co/ [38]
 [40]
[40]And so it comes to pass that the war of attrition is not just between Israel and the Palestinians, but between Israel and the US and the Arab states, Iran and the Islamic states. The extent of the battlefield is only now taking shape.